Statistics
You can access your statistics by going to the account stats dashboard, this is found on the landing page of your account. you can easily return to it from anywhere by clicking on the Jet-Stream logo in the top-left corner.
StreamStats (Realtime Statistics)
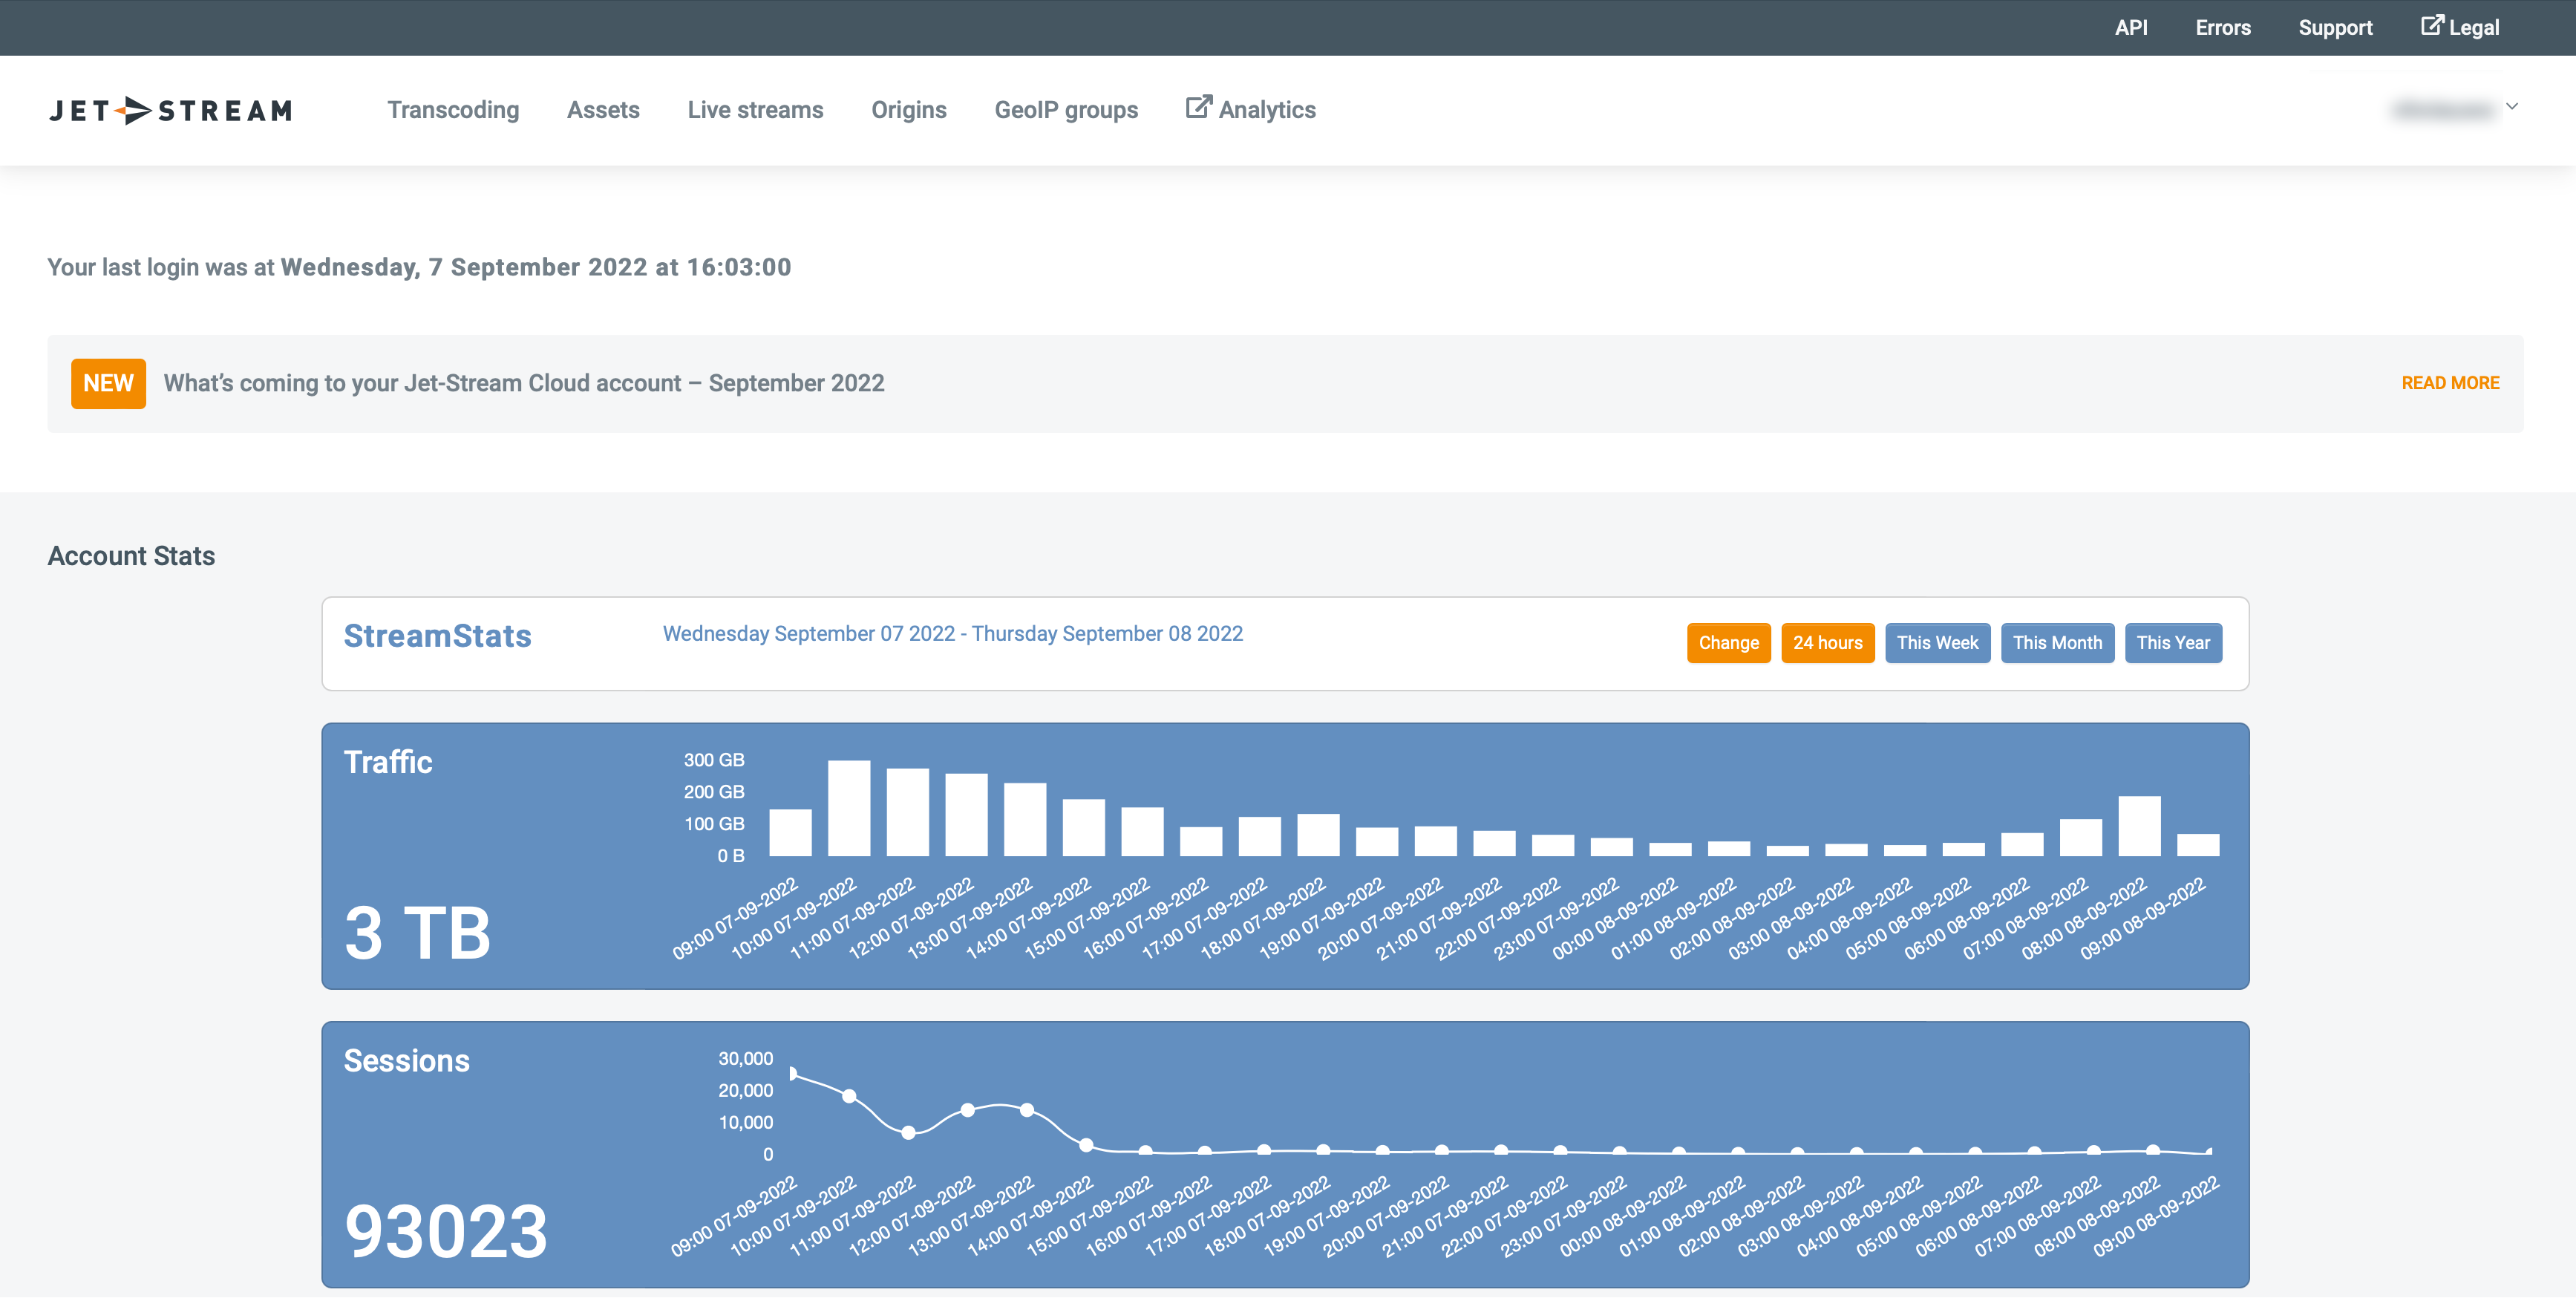
The top bar shows the measured traffic by our log processing engine, the second bar shows the count of sessions. See What is a "Session" for how we defined a session.
Top video assets
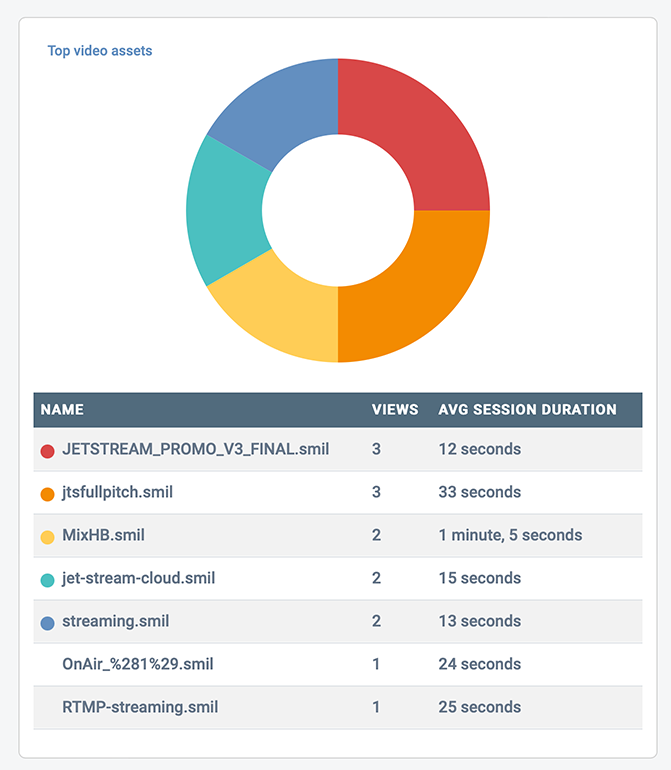
Shows a list of the top assets ordered by views/sessions.
Top livestream assets (including Radio)
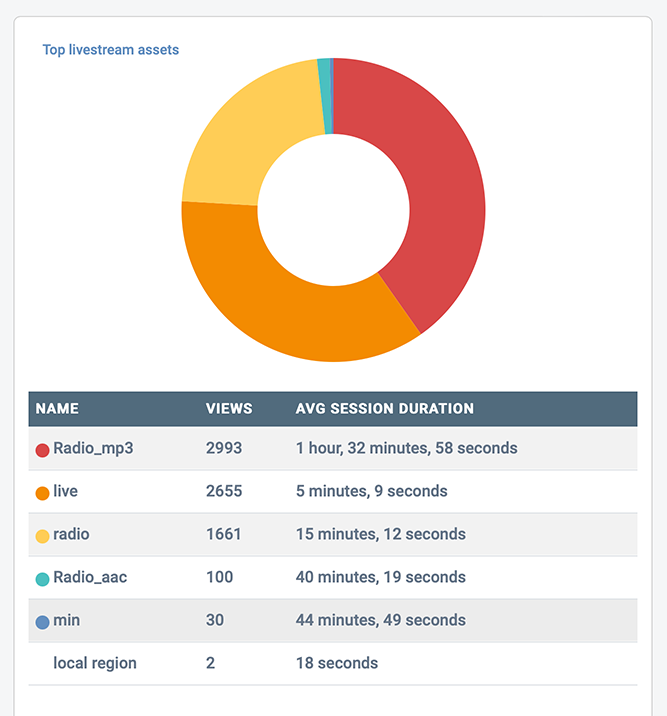
Shows a list of top live assets (including Radio a.k.a. Icecast) ordered by views/listens/sessions.
Devices
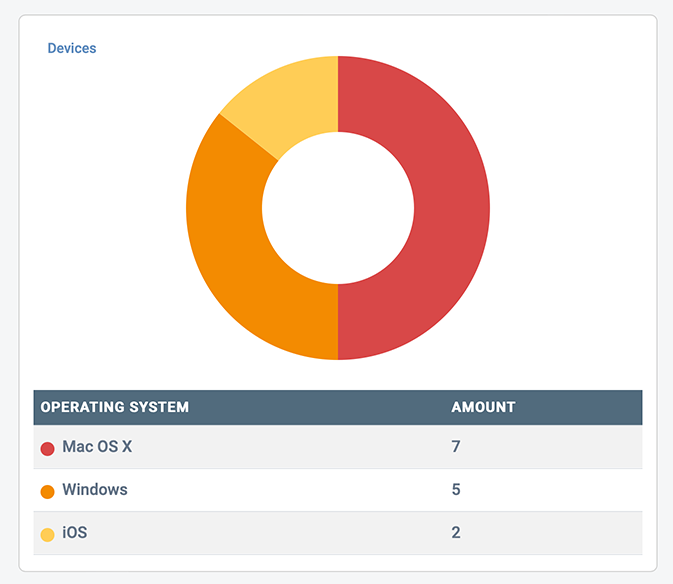
Shows a list of top devices by view/session.
Map and countries
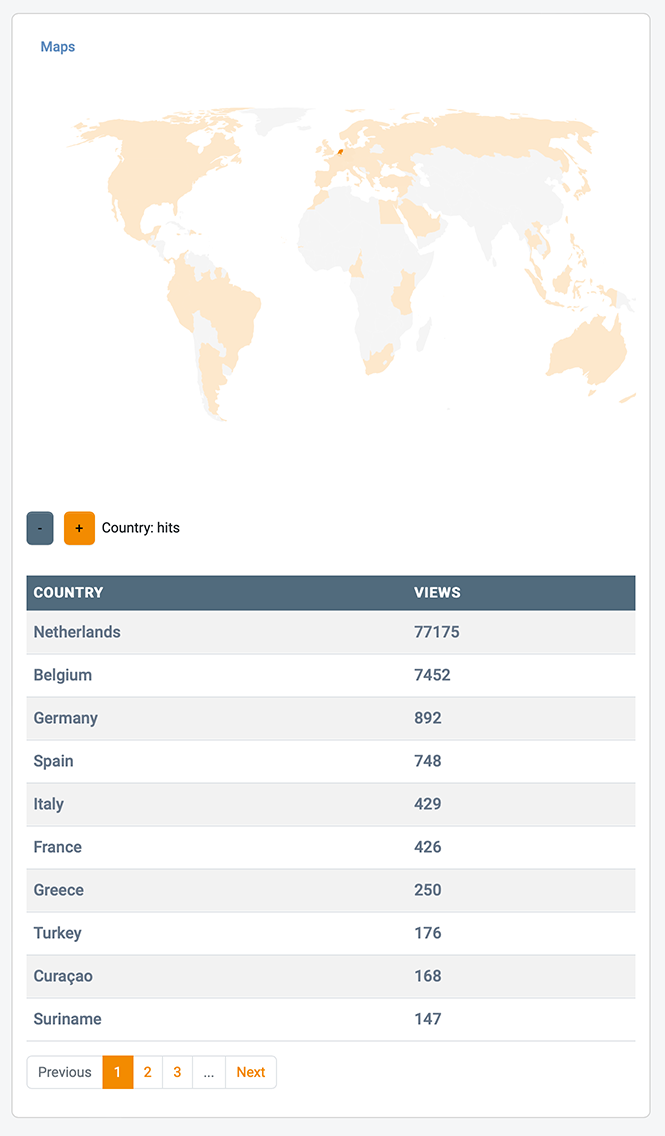
Shows a map and list of countries, you can zoom in on the map too. It is sorted by views/sessions.
Referrers
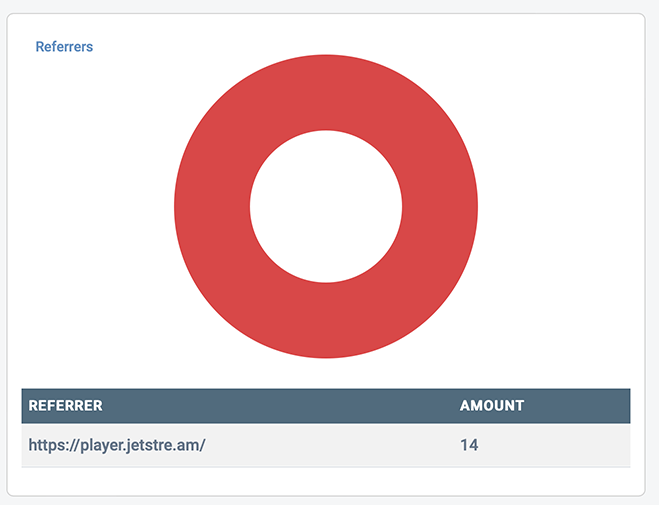
Shows a list of top referrers. These are typically video or audio players on a website or a device.
What is a "Session"
Background
At Jet-Stream we realized that many people tend to block analytical tools running on the client (web browser). As a result of this, the data from these tools is often inaccurate and incomplete. This is why at Jet-Stream we are calculating your statistics server-side. This, however, comes with a few caveats:
The video "Session"
To save bandwidth and to increase performance, Jet-Stream splits up your streams and videos into many small chunks.
When a viewers watches content via Jet-Stream, the player is constantly requesting new chunks from the server for the viewer to watch.
A session then, is a representation of all fetched chunks from the first chunk, until the last. From this we calculate the "session duration", and the "average session duration" by aggregating them together.
Short video inaccuracies
Many players, including the player provided by Jet-Stream, pre-buffer some chunks for instant playback when the play button is pressed.
Since the server cannot differentiate between pre-buffering and actually playing the video, these short sessions are disregarded. As a side effect however, this results in shorter videos not having accurate data as all their chunks are often pre-buffered resulting in the disregarding of those sessions. At the moment a session needs to have a duration of at least 10 seconds to be taken into consideration.
Jet-Stream's player
Using Jet-Streams player, one chunk of 4 seconds is requested upon loading the page, so videos shorter than 4 seconds will never get statistics.
The Icecast "Session"
When it comes to streaming audio content via Icecast, the session data is calculated by analyzing all incoming requests. Since Icecast data is not chunked, all data is processed.
404 Errors
You can access 404 errors by clicking on the link on the statistics tab. You will see the 404 errors of the last 30 minutes. An 404 error will happen when the resource cannot be accessed. Below you find some scenarios when a 404 error will happen: The asset doesn't exist (typos included) The requested file is locked and the token received by the Rediraptor is not correct. Please check the code on your website that generates the token. The requested file is geo-locked to certain countries and the request does not originate from one of the permitted countries. The requested file is not processed yet.
How we calculate your traffic
When people watch or listen to your content, there are bytes transferred from our infrastructure and CDN partners to the clients. We use this traffic to divide the costs among our customers. There are several factors that weigh into the costs that are not exposed in traffic to viewers and listeners. For example, there are costs associated with delivering the content from our servers to the CDN’s, that are not reflected in the traffic to the client. For Icecast users, there are socket connections open for as long as the user is listening, occupying a connection in our infrastructure that could otherwise be used to transfer several gigabytes of HTTP traffic per hour.
So we have created a model where we try to reflect the actual infrastructure costs in the traffic volume our customers use.
For HTTP traffic we have a gross/net ratio of 1.14. So we have a 14% traffic overhead to what we actually deliver to the clients. For icecast due to the relative low volume, but high costs in router and firewall capacity we have about twice the costs per gigabyte opposed to HTTP traffic.
To make our pricing and traffic calculations fairer, we correct the traffic volume to accommodate for this (like all CDN’s do by the way). All icecast traffic is multiplied by 1.5. And all traffic is multiplied by 1.07. In addition, we have a fair use policy that the use of icecast traffic in your account is limited to 15% of your total traffic bundle. This is to prevent we lose money and can’t continue icecast services as an included service at no additional charge.
If you need information about the net traffic, we do have an API with our statistics that is able to get you net and gross bytes if you need this. Our API also corrects the gross numbers we get from upstream CDN’s, so they represent every byte that was delivered for you.
The use of units in our traffic reporting
All traffic is measured in bytes. We do not round the numbers in processing. We use the Si (metric) units, so 1.000.000 (million) bytes is one megabyte, 1000 megabytes (MB) are a gigabyte (GB). Some old systems use the 1024 factor because computers can make that calculation quicker due to their binary nature, 2^10 is 1024. Those units should be referenced as mebibyte (MiB) or gibibyte (GiB). We exclusively use the Si units like MB and GB.